Wealth Disparity Unveiled: Decoding the Gap Between Average and Median Wealth
The provided data on wealth per adult across various countries below offers a fascinating glimpse into global economic landscapes, but a deeper dive into the figures reveals a critical dimension often overlooked: the disparity between average and median wealth. This gap is a powerful indicator of wealth distribution within a nation, highlighting countries where a small segment of the population holds a disproportionately large share of the wealth.
The Significance of the Gap: Average vs. Median
To understand the implications, it's essential to differentiate between average (mean) and median wealth:
- Average Wealth: This is calculated by summing the total wealth of all individuals and dividing by the number of individuals. It can be heavily skewed by a few extremely wealthy individuals, pulling the average upwards even if most people have modest wealth.
- Median Wealth: This represents the wealth of the person exactly in the middle of the wealth distribution. Half the population has more wealth than the median, and half has less. It is a more robust measure of "typical" wealth and is less affected by extreme outliers.
When the average wealth is significantly higher than the median wealth, it strongly suggests a highly unequal distribution of wealth. This indicates that a considerable portion of the total wealth is concentrated in the hands of a relatively small number of wealthy individuals, while the majority of the population holds much less. Conversely, a smaller gap between average and median wealth points to a more equitable distribution.
Countries with Striking Disparities
Analyzing the provided data, several countries stand out due to the substantial difference between their average and median wealth per adult:
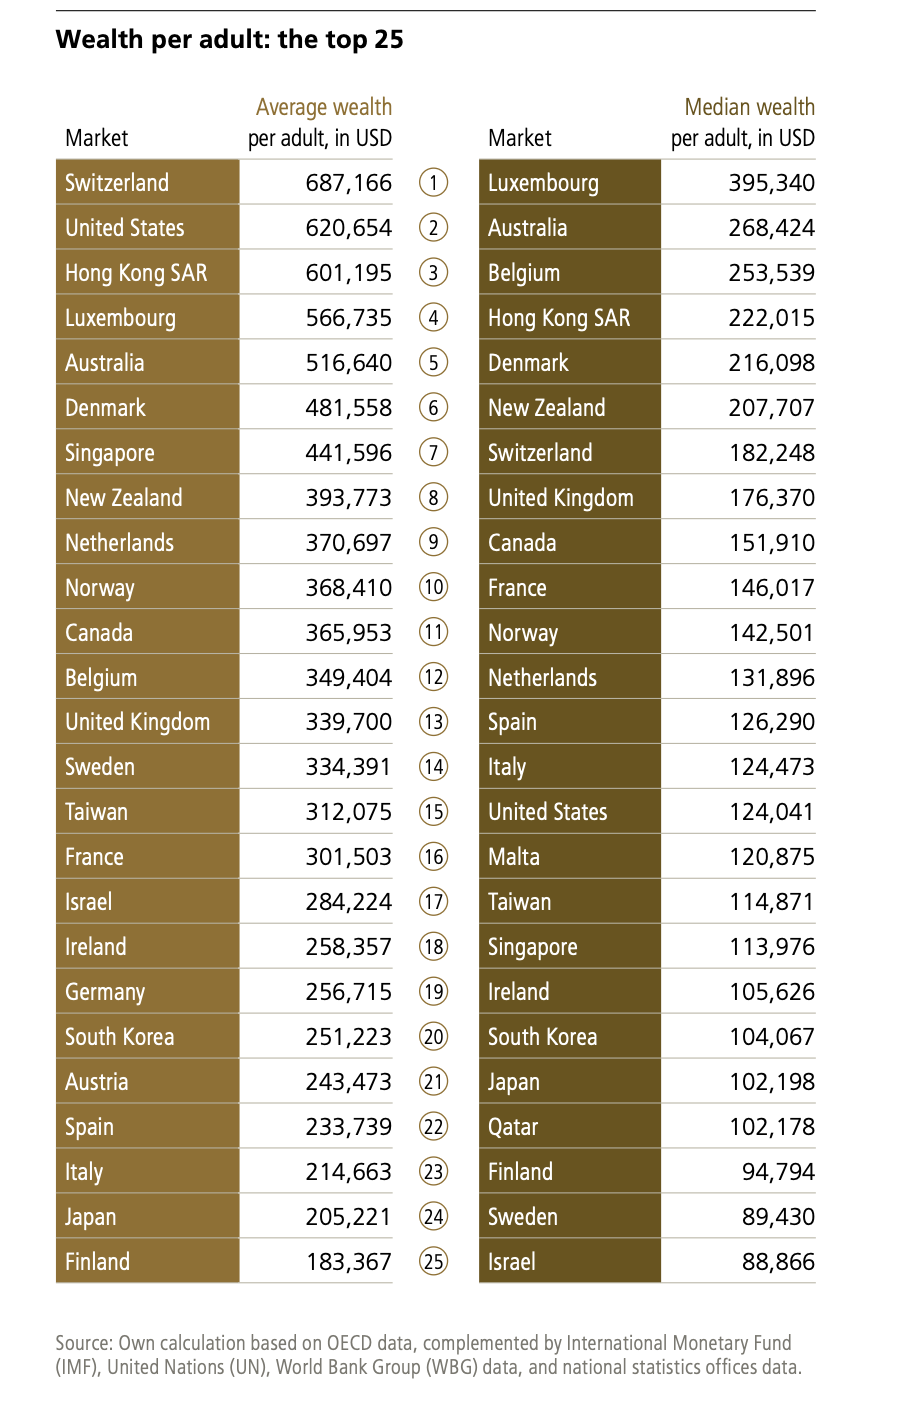
- Switzerland: With an average wealth of $687,166 and a median of $182,248, Switzerland exhibits the largest absolute difference among the top countries. This significant gap suggests a highly concentrated wealth at the very top, even though the average wealth is globally unparalleled.
- United States: The US also shows a considerable disparity, with an average of $620,654 and a median of $124,041. This is a well-documented characteristic of the US economy, where wealth inequality has been a persistent concern.
- Hong Kong SAR: While both its average ($601,195) and median ($222,015) wealth are high, the difference is still substantial, indicating a significant concentration of wealth.
- Singapore: With an average of $441,596 and a median of $113,976, Singapore presents another case of a notable gap, pointing to a hierarchical wealth structure despite its overall economic prosperity.
- Denmark: The average wealth is $481,558, while the median is $216,098. While perhaps less extreme than some others, this still suggests a concentration of wealth.
- Australia: Average wealth stands at $516,640, with a median of $268,424. While the median is relatively high, the difference still signifies that the average is boosted by a wealthier segment.
Other notable examples include Norway (average $368,410 vs. median $142,501) and Canada (average $365,953 vs. median $151,910).
The Significance for Equality
The large discrepancy between average and median wealth has profound implications for social and economic equality:
- Concentration of Power: When wealth is highly concentrated, it often translates into concentrated economic and political power. A small elite can disproportionately influence policies, regulations, and economic decisions, potentially to their own benefit rather than for broader societal welfare.
- Reduced Social Mobility: Significant wealth inequality can create barriers to social mobility. Individuals from less wealthy backgrounds may face greater challenges in accessing quality education, healthcare, and opportunities, perpetuating cycles of disadvantage.
- Social Unrest and Instability: Extreme wealth disparities can lead to social unrest and political instability. A sense of unfairness and exclusion among the majority can erode social cohesion and trust in institutions.
- Slower Economic Growth: While some argue that wealth concentration can drive investment, excessive inequality can actually hinder long-term economic growth. It can reduce overall demand, limit human capital development, and stifle innovation by excluding a large segment of the population from full economic participation.
- Erosion of Public Goods: When the wealthy accumulate vast sums, they may increasingly opt for private services (education, healthcare, security), potentially reducing their support for public goods and services that benefit everyone.
Countries with More Equitable Distributions
Conversely, countries where the average and median wealth are closer indicate a more even distribution. While the table primarily focuses on high-wealth nations, we can infer that countries with smaller gaps (or those not appearing in the top ranks for average wealth but still having a respectable median) are likely to exhibit greater equality in wealth distribution. For instance, Belgium ($349,404 average vs. $253,539 median) has a comparatively smaller gap among the listed wealthy nations. Similarly, while not at the top for average wealth, Spain has an average of $233,739 and a median of $126,290, suggesting a less extreme skew than some of the top-tier average wealth countries.
Conclusion
The divergence between average and median wealth serves as a crucial metric for assessing the state of wealth equality within nations. While high average wealth may indicate overall prosperity, a wide gap between the average and median points to significant disparities that can undermine social cohesion, limit economic opportunity, and potentially lead to societal instability. Policymakers and citizens alike should pay close attention to these figures, as they offer valuable insights into the true economic well-being and fairness of a society. Addressing these disparities through progressive taxation, robust social safety nets, investment in public services, and opportunities for all remains a critical challenge for many of the world's wealthiest nations.